Contents
Scroll to:
https://doi.org/10.21886/2219-8075-2024-15-1-141-147
Scroll to:
Objective: to assess the thickness of epicardial adipose tissue in patients of different BMI, to establish relationships with the lipid profile during 48 months of observation.
Materials and methods: 121 men were selected for an open prospective study. Three main groups were identified: group 1 — 24 patients with normal BMI (20%), group 2 — 35 men with excess BMI (29%), group 3 — 62 obese patients (51%). The control group (4) included 27 practically healthy men. Three stages of prospective observation of patients were determined: at the time of hospitalization, 12 and 48 months (±2 weeks) from the index event.
Results: EAT thickness measured by echocardiography in patients with STEMI correlated with BMI, waist circumference (WC) throughout of the entire study, the strength of the connection was significantly higher with OT. EAT thickness in patients with STEMI increased in the over-BMI and obesity groups from the beginning to the end of the study (p <0.05) and was statistically significantly higher than in the control group and in patients with normal BMI. Throughout the study, eVT had a weak positive correlation with the level of blood triglycerides, total cholesterol and LDL-C.
Conclusions: the thickness of epicardial adipose tissue correlates with waist circumference and atherogenic indicators of lipid metabolism.
Zakovryashina I.N., Khaisheva L.A., Shlyk S.V., Shaposhnikova V.V., Zakusilova A.D. The effect of an increased body mass index and obesity on the thickness of epicardial adipose tissue in men who underwent STEMI. Medical Herald of the South of Russia. 2024;15(1):141-147. (In Russ.) https://doi.org/10.21886/2219-8075-2024-15-1-141-147
In Russia, the prevalence of obesity is detected in all age groups and is commonly revealed in more than 50% of the examined cases; the same trend exists in other countries of the world [1]. Within the framework of the epidemiological study ESSE-RF 2, significant associations of cardiac ischemia coronary with obesity, especially abdominal obesity, were noted without gender specificities [2][3]. Obesity is a serious challenge to the quality and longevity of life. Obese people live an average of 15.4 years less than people with normal weight [4]. Body mass index (BMI) is considered the gold standard for diagnosing obesity but it is not a reliable indicator of body constitution since it cannot show the distribution of fat tissue in the body. Indices such as waist circumference (WC), hip circumference (HC), and waist-to-hip ratio (WC/HC) are more associated with progressing myocardial infarction risk [5]. Obesity promotes the accumulation of epicardial fat and fatty infiltration of the myocardium [6]. Increased epicardial adipose tissue (EAT) becomes a source of free fatty acids contributing to the clinical and metabolic complications caused by obesity [7].
The purpose of the study was to assess the dynamics of EAT thickness and lipid profile in patients with different BMIs over 48 months of their monitoring.
The study was approved by the local ethics committee. According to the inclusion and exclusion criteria, 121 men were selected for the prospective open-label study. The average age of the subjects was 59.4 ± 8.5 years. Inclusion criteria were the following: informed consent signed by the patient, age of men over 18 years and under 74 years, percutaneous coronary intervention with lesions of no more than two vessels, and no more than two stents installed. Exclusion criteria involved recurrent acute myocardial injury, the presence of clinical concomitant pathology, and a history of type 2 diabetes mellitus.
Three main test groups were separated: group I included 24 patients with normal BMI (20%), group II consisted of 35 patients with excess BMI (29%), and group III consisted of 62 patients with obesity (51%). The control group (IV) included 27 apparently healthy men. Three stages of prospective examination of patients were defined: the first one was at the time of hospitalization, and then in 12 and 48 months (±2 weeks) from the index event. At each examination at the research center, in addition to measuring BMI, WC, and WC/HC, the EAT thickness was determined by ultrasound, as well as blood lipid levels were tested. Calculation of the linear thickness of EAT was carried out in the B-mode of the echocardiography (EchoCG) technique in the standard left parasternal position along the long and short axis of the left ventricle with a sensor Philips Epiq 7. WC and height were measured, and BMI was calculated according to the WHO classification. Throughout the study, patients took at least 80% of the obligatory medication groups, according to the Morisky-Green questionnaire of adherence to therapy.
Statistical analysis and processing of collected data were performed using the R Project for Statistical Computing (version 3.2, R Foundation for Statistical Computing, Vienna, Austria) and Statistica 10.0.228.8 (InstallShield Software Corp., Chicago, IL, USA) software. A comparison of variables in groups was carried out using the Mann-Whitney and Kruskal-Wallis tests. The differences were considered statistically significant at the p<0.05 level.
Adherence to therapy was assessed using the Morisky–Green Scale (MMAS-4), which implies the total intake of at least 80% of prescribed medications. At the stage of 12 months (n=108 people), 103 patients (95.37%) received lipid-lowering therapy; at the end of 48 months (n=102 people), 83 patients (81.37%) received lipid-lowering therapy. Patients of different BMI groups were comparable in terms of lipid-lowering therapy.
EAT thickness measured by echocardiography in patients with an acute ST-elevation myocardial infarction (STEMI) correlated with BMI and WC measuring data throughout all stages of the study (Figs. 1–3). WC correlated with epicardial tissue thickness with a strong positive relation, in contrast to BMI, where the correlation was moderate.
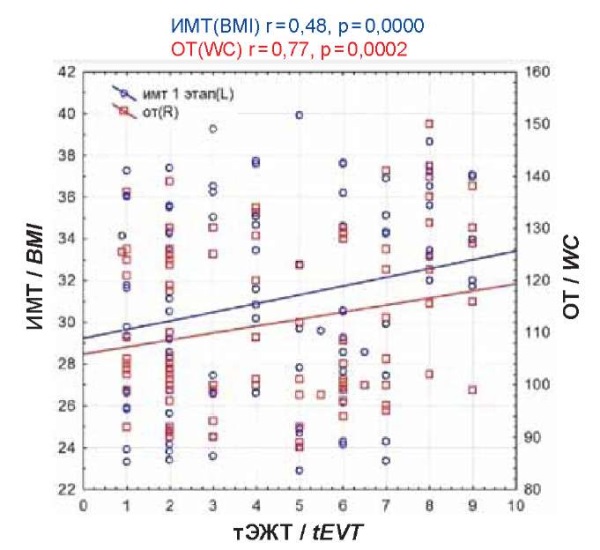
Figure 1. Correlation of eVT with BMI, WC during hospitalization.
Рисунок 1. Корреляция тЭЖТ с ИМТ, ОТ на госпитализации.
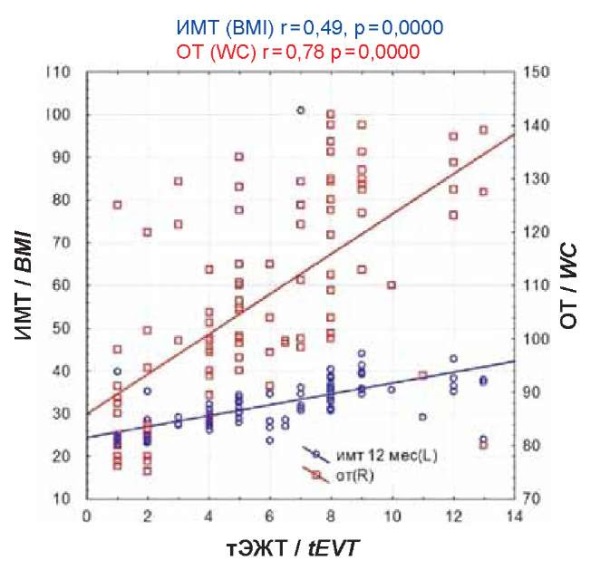
Figure 2. Correlation of TEVT with BMI, WC after 12 months.
Рисунок 2. Корреляция тЭЖТ с ИМТ, ОТ через 12 месяцев.
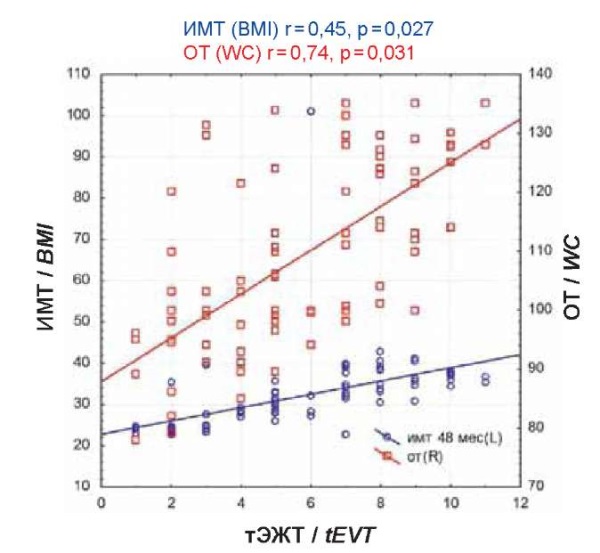
Figure 3. Correlation of eVT with BMI, WC after 48 months.
Рисунок 3. Корреляция тЭЖТ с ИМТ, ОТ через 48 месяцев.
In Figure 4, one can see that EAT thickness in patients with STEMI increased in two groups, namely in patients with over-BMI and in patients with obesity, at all stages from the beginning to the end of the study (p<0.05), and was significantly higher than in the control group and the group of patients with normal BMI.
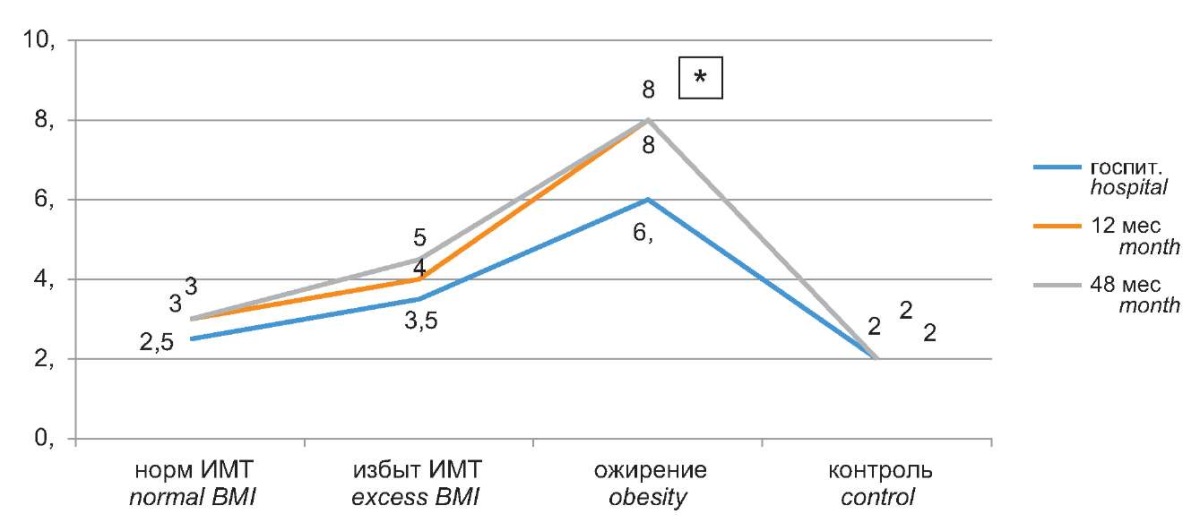
Figure 4. Dynamics of epicardial adipose tissue thickness in groups of patients
of different BMI over 48 months normal BMI excess BMI obesity control.
Рисунок 4. Динамика толщины эпикардиальной жировой ткани
в группах пациентов разного ИМТ в течение 48 месяцев.
EAT thickness through all stages of the study had a weak positive correlation with the levels of blood triglycerides (TGs), total cholesterol (TC), and low-density lipoprotein cholesterol (LDL-C) and did not have a correlation with high-density lipoprotein cholesterol (HDL-C) (Table 1).
Таблица / Table 1
Корреляционные связи толщины ЭЖТ с липидным профилем пациентов,
перенёсших ИМпST, в ходе 48 месяцев наблюдения
Correlations between EAT thickness and the lipid profile of patients
who had a STEMI during 48 months of follow-up
|
Госпитализация Hospitalization |
12 мес. 12 months |
48 мес. 48 months |
||||
|
Показатель Index |
Коэффициент корреляции Coefficient correlation |
Уровень значимости, р Significance level, p |
Коэффициент корреляции Coefficient correlation |
Уровень значимости, р Significance level, p |
Коэффициент корреляции Coefficient correlation |
Уровень значимости, р Significance level, p |
|
ОХС Cholesterol (mmol/l) |
0.08 |
0,006* |
0.03 |
0,007* |
0.03 |
0,006* |
|
ХС-ЛПВП HDL Cholesterol (mmol/l) |
-0.12 |
0,44 |
-0.10 |
0,38 |
-0.13 |
0,22 |
|
ХС-ЛПНП Cholesterol-LDL (mmol/l) |
0.28 |
0,007* |
0.22 |
0,022* |
0.46 |
0,005* |
|
ТГ Triglycerides (mmol/l) |
0.23 |
0,05* |
0.39 |
0,05* |
0.35 |
0,005* |
Increased TC, hypertriglyceridemia, and decreased HDL-C were significantly more common in the group of patients with obesity. At the time of hospitalization, the values of LDL-C, TGs, and total blood cholesterol in the patients were augmented along with an increase in BMI and were significantly higher in the group of patients with obesity; the HDL-C level, on the contrary, dropped as BMI increased. At the outpatient stage, in groups with different BMIs, no significant decreases in lipid profile parameters were detected compared to the hospital stage. Hypertriglyceridemia and an increase in LDL-C as well as the TC level persisted in patients with an increased BMI. Besides, a corresponding decrease in HDL-C was also kept (Table 2).
Таблица / Table 2
Липидный профиль пациентов на протяжении 48 месяцев
Lipid profile of patients over 48 months
|
Показатель Index |
Группы ИМТ BMI groups |
р |
||
|
Нормальный ИМТ Normal BMI |
Избыточный ИМТ Excessive BMI |
Ожирение Obesity |
||
|
Госпитализация Hospitalization (n 121) |
n=24 |
n=35 |
n=62 |
|
|
ОХС Cholesterol (мmmol/l) |
4,33 [ 3,71;5,02] |
5,19 [ 4,16;6,39] |
5,98 [ 4,24;6,62] |
0,19 0,04* 0,03² |
|
ХС-ЛПВП HDL cholesterol (mmol/l) |
1,23 [ 0,90;1,45] |
1,10 [ 0,9;1,50] |
0,09 [ 0,89;1,03] |
*0,21 **0,14 ***0,01 |
|
ХС-ЛПНП Cholesterol-LDL (mmol/l) |
1,83 [ 1,29;2,45] |
2,60 [ 1,87;2,79] |
2,70 [ 2,59;3,03] |
*0,64 **0,35 ***0,02 |
|
ТГ Triglycerides (mmol/l) |
1,57 [ 1,16;2,77] |
2,11 [ 2,06;3,18] |
3,45 [ 2,17;3,9] |
*0,78 **0,023 **0,00002 |
|
12 месяцев 12 months (n 110) |
n=21 |
n=30 |
n=57 |
|
|
ОХС Cholesterol (mmol/l) |
4,25 [ 3,89;5,13] |
4,9 [ 4,07;6,39] |
4,98 [ 4,24;5,6] |
0,19 0,039* 0,027² |
|
ХС-ЛПВП HDL cholesterol (mmol/l) |
1,1 [ 0,99;1,33] |
1,21 [ 1,0;1,42] |
1,02 [ 0,9;1,2] |
0,29 0,04³ |
|
ХС-ЛПНП Cholesterol-LDL (mmol/l) |
2,15 [ 1,7;2,95] |
3,4 [ 2,0;3,7] |
3,2 [ 2,0;3,6] |
0,05* 0,37 0,05² |
|
ТГ Triglycerides (mmol/l) |
1,68 [ 1,49;1,79] |
1,75 [ 1,2;2,25] |
2,89 [ 1,58;3,7] |
0,08* 0,000012² 0,03³ |
|
48 месяцев 48 months (n 102) |
n=24 |
n=27 |
n=51 |
|
|
ОХС Cholesterol (mmol/l) |
3,75 [ 3,45;4,6] |
5,74 [ 4,49;6,45] |
5,57 [ 4,69;6,18] |
0,0004* 0,00005² |
|
ХС-ЛПВП HDL cholesterol (mmol/l) |
1,3 [ 1,1;1,39] |
1,01 [ 1,01;1,12] |
1,01 [ 0,92;1,15] |
0,046* 0,39 |
|
ХС-ЛПНП Cholesterol-LDL (mmol/l) |
2,8 [ 1,7;2,0] |
2,6 [ 2,14;3,35] |
2,55 [ 2,01;3,01] |
0,0002* 0,00002² 0,57³ |
|
ТГ Triglycerides (mmol/l) |
1,70 [ 1,68;1,79] |
1,98 [ 1,69;2,4] |
2,87 [ 1,7;2,99] |
0,024* 0,0005² 0,38³ |
Примечание: Me [Q25; Q75] — медианы и межквартильный размах;
* — нормальный ИМТ и избыточный ИМТ;
** — избыточный ИМТ и ожирение;
*** — нормальный ИМТ и ожирение;
сравнение проводилось с помощью рангового анализа Краскела-Уоллиса
с последующим попарным сравнением.
Note: Me [Q25; Q75] — medians and interquartile range;
* — normal BMI and excess BMI;
** — excessive BMI and obesity;
*** — normal BMI and obesity;
comparisons were made using Kruskal-Wallis rank analysis
followed by pairwise comparisons.
Obesity and endothelial injuries contribute to progressive lipid metabolism disorders and accelerate the atherosclerosis process [8]. The increase in LDL-C in patients with obesity is accounted for by the endocrine dysfunction of the adipose tissue and the disorders of the synthesis and metabolism of atherogenic lipoproteins [9]. In patients with STEMI included in this study, the level of LDL-C was higher than in the control group. Patients with obesity maintained elevated LDL-C and TG levels through all stages of the study, which did not contradict data presented by other researchers [10]. HDL-C in the index group was within the normal range, but the consideration of the obtained data by BMI values in the groups revealed a significant drop in the HDL-C level as BMI increased; these data were also consistent with the results presented in other works [11].
Epidemiological investigations confirmed the association of EAT thickness with atherosclerosis [12]. Dönmez described an elevation of the LDL-C and TC levels upon increasing the EAT thickness in patients with and without familial hypercholesterolemia [13]. Manno drew attention to the fact of an increase in LDL-C in patients with excess BMI and obesity upon increasing EAT thickness [14]. Wu described a negative relationship between EAT thickness and HDL-C [15]. Goeller found negative relationships between EAT volume and HDL-C levels and positive relationships with LDL and TGs in patients with early atherosclerosis. What deserves special attention in his work is the fact that EAT density, unlike its thickness, had inverse relationships with lipid profile parameters in those patients [16]. In the geriatric population, the accumulation of EAT along with obesity was determined by the TC and LDL-C levels [17]. Upon cardiac ischemia coronary, EAT increased to a greater extent at unstable angina compared with exertional angina [17]. An increase in EAT thickness has been shown in visceral obesity and augmenting of BMI [6][18]. Positive correlations between EAT thickness and BMI and WC have been identified in patients with cardiac ischemia [19]. In the patients included in the study, EAT thickness was positively correlated with BMI and WC through all stages of the examination.
The failure to achieve target lipid levels in examined patient groups may be stipulated by the insufficient titration of lipid-correcting therapy doses.
With an increase in BMI in men who had suffered a STEMI, the thickness of the EAT increased and became significantly higher by the 48th month of observation in groups of patients with excess BMI and patients with obesity. Patients with obesity and excess BMI had significantly higher levels of TC, LDL-C, and TGs but significantly lower levels of HDL-C in the blood serum. Positive correlations between EAT and the levels of TC, LDL-C, and TGs were established during the 48-month monitoring.
1. Kashtalap V, Fedorova N, German A, Pecherina T, Kokov A, et al. Lipid metabolism disorders in myocardial infarction patients with preserved left ventricular ejection fraction depending on the presence of obesity. Atherosclerosis. 2018;275:e247-e-248. https://doi.org/10.1016/j.atherosclerosis.2018.06.787
2. Shalnova S.A., Deev A.D., Muromtseva G.A., Balanova J.A., Imaeva A.E., et al. Relation of anthropometric indexes and coronary heart disease. Cardiovascular Therapy and Prevention. 2018;17(3):11-16. (In Russ.) https://doi.org/10.15829/1728-8800-2018-3-11-16
3. Boytsov S.A., Drapkina O.M., Shlyakhto E.V., Konradi A.O., Balanova Yu.A., et al. Epidemiology of Cardiovascular Diseases and their Risk Factors in Regions of Russian Federation (ESSE-RF) study. Ten years later. Cardiovascular Therapy and Prevention. 2021;20(5):3007. https://doi.org/10.15829/1728-8800-2021-3007
4. de Cosio FG, Diaz-Apodaca B, Baker A, Cifuentes MP, Ojeda-Casares H, et al. US Obesity Mortality Trends and Associated Noncommunicable Diseases Contributing Conditions Among White, Black, and Hispanic Individuals by Age from 1999 to 2017. SN Compr Clin Med. 2021;3(6):1334-1343. https://doi.org/10.1007/s42399-021-00850-2
5. Castellanos AM. Obesity and Risk of Myocardial Infarction in Males What is the Best Anthropometric Indicator in the Risk Prediction? Nutri Food SciInt J. 2018;6(1):555685. https://doi.org/10.19080/NFSIJ.2018.06.555685
6. Kim E, Choe YH, Han BK, Kim SM, Kim JS, et al. Right ventricular fat infiltration in asymptomatic subjects: observations from ECG-gated 16-slice multidetector CT. J Comput Assist Tomogr. 2007;31(1):22-28. https://doi.org/10.1097/01.rct.0000236416.05267.6c
7. Drapkina O.M., Korneeva O.N., DrapkinaYu.S. Epicardial fat: attacking or main? Rational pharmacotherapy in cardiology. 2021;9(3):287-291. (In Russ.)
8. Sergienko I.V., Nedogoda S.V., Vertkin A.L., Glezer M.G., Gurevich V.S., et al. Actual questions of increasing the availability of innovative therapy and the organization of medical care for patients with atherosclerotic cardiovascular diseases in the Russian Federation. Advisory Board. The Journal of Atherosclerosis and Dyslipidemias. 2022;4(49):54–61. (In Russ.) https://doi.org/10.34687/2219-8202.JAD.2022.04.0006
9. Sergienko V.B., Ansheles A.A., Sergienko I.V., Boytsov S.A. Relationship of obesity, low-density lipoprotein cholesterol and myocardial perfusion in patients with risk factors and without atherosclerotic cardiovascular diseases. Cardiovascular Therapy and Prevention. 2021;20(2):2734. (In Russ.) https://doi.org/10.15829/1728-8800-2021-2734
10. Nedogoda S.V., Barykina I.N., Salasyuk A.S. National clinical guidelines on obesity: concept and prospects. Bulletin of VolGMU. 2017;1(61):134-140. (In Russ.) eLIBRARY ID: 28864600 EDN: YHQTDF
11. Dedov I.I., Mokrysheva N.G., Mel’nichenko G.A., Troshina E.A., Mazurina N.V., et al. Obesity. Clinical guidelines. Consilium Medicum. 2021;23(4):311–325. https://doi.org/10.26442/20751753.2021.4.200832
12. Bornachea O, Vea A, Llorente-Cortes V. Interplay between epicardial adipose tissue, metabolic and cardiovascular diseases. Clin Investig Arterioscler. 2018;30(5):230-239. (In English, Spanish). https://doi.org/10.1016/j.arteri.2018.03.003
13. Dönmez Y, Bulut A. Epicardial fat thickness is signifi cantly increased and related to LDL cholesterol level in patients with familial hypercholesterolemia. J Ultrasound. 2019;22(3):309-314. https://doi.org/10.1007/s40477-019-00368-3
14. Manno C, Disanto G, Bianco G, Nannoni S, Heldner MR, et al. Outcome of endovascular therapy in stroke with large vessel occlusion and mild symptoms. Neurology. 2019;93(17):e1618-
15. e1626. Erratum in: Neurology. 2020. PMID: 31591276. https://doi.org/10.1212/WNL.0000000000008362
16. Wu Y, Zhang A, Hamilton DJ, Deng T. Epicardial Fat in the Maintenance of Cardiovascular Health. Methodist Debakey Cardiovasc J. 2017;13(1):20-24. https://doi.org/10.14797/mdcj-13-1-20
17. Goeller M, Achenbach S, Marwan M, Doris MK, Cadet S, et al. Epicardial adipose tissue density and volume are related to subclinical atherosclerosis, inflammation and major adverse cardiac events in asymptomatic subjects. J Cardiovasc Comput Tomogr. 2018;12(1):67-73. https://doi.org/10.1016/j.jcct.2017.11.007
18. Conte M, Petraglia L, Poggio P, Valerio V, Cabaro S, et al. Inflammation and Cardiovascular Diseases in the Elderly: The Role of Epicardial Adipose Tissue. Front Med (Lausanne). 2022;9:844266. https://doi.org/10.3389/fmed.2022.844266
19. Sousa JA, Mendonça MI, Serrão M, Borges S, Henriques E, et al. Epicardial Adipose Tissue: The Genetics Behind an Emerging Cardiovascular Risk Marker. Clin Med Insights Cardiol. 2021;15:11795468211029244. https://doi.org/10.1177/11795468211029244
20. Jeong JW, Jeong MH, Yun KH, Oh SK, Park EM, et al. Echocardiographic epicardial fat thickness and coronary artery disease. Circ J. 2007;71(4):536-539. https://doi.org/10.1253/circj.71.536
Irina N. Zakovryashina, cardiologist, postgraduate student of the Department of Therapy with a course of outpatient therapy
Rostov-on-Don
Larisa A. Khaisheva, Dr. Sci. (Med.), Professor of the Department of Therapy with a course of outpatient therapy
Rostov-on-Don
SergeyV. Shlyk, Dr. Sci. (Med.), Prof., Head of the Department of Therapy with a course of outpatient therapy
Rostov-on-Don
Victoria V. Shaposhnikova, student
Rostov-on-Don
Anna D. Zakusilova, student
Rostov-on-Don
Zakovryashina I.N., Khaisheva L.A., Shlyk S.V., Shaposhnikova V.V., Zakusilova A.D. The effect of an increased body mass index and obesity on the thickness of epicardial adipose tissue in men who underwent STEMI. Medical Herald of the South of Russia. 2024;15(1):141-147. (In Russ.) https://doi.org/10.21886/2219-8075-2024-15-1-141-147
29, Nakhichevansky Lane, Rostov-on-Don, 344002
Rostov State Medical University
Тel.: +79185710558
e-mail: journal@medicalherald.ru