


Contents
Scroll to:
https://doi.org/10.21886/2219-8075-2025-16-2-55-64
Scroll to:
Objective: to study the clinical features of depression in men with low testosterone levels. Materials and methods: the study included 140 males aged 18 to 65 years diagnosed with recurrent depressive disorder (F33) and a depressive episode (F32) according to ICD-10. The main group consisted of men with depression comorbid with testosterone deficiency (n = 90). The control group included men with depression and normal testosterone levels (n = 50). Results: symptoms of depression in men with testosterone deficiency were less severe and led to less functional disturbance. There were some clinical differences in symptoms and syndromes such as sexual function, sleep, irritability, alcohol consumption, severe and functionality, main syndrome etc. For the main group was more typical mono-episode with manifestation at a later age while for the control group recurrent episodes manifesting at an earlier age were more typical. Conclusions: depression in men with testosterone deficiency has a number of differences that must be taken into account when diagnosing and choosing treatment tactics.
Osadshiy Yu.Yu., Kryuchkova M.N., Sidorov A.A., Perekhov A.Ya. Clinical features of depression in men with testosterone deficiency. Medical Herald of the South of Russia. 2025;16(2):55-64. (In Russ.) https://doi.org/10.21886/2219-8075-2025-16-2-55-64
For several decades, depression has been actively studied, with ongoing efforts to understand its characteristics, differences in manifestation, treatment, and prevention. Numerous factors influence the course of depression, including the functioning of the endocrine system and testosterone levels [1][2]. Testosterone itself can significantly affect emotional regulation in men; therefore, depression in men with low testosterone levels may present differently compared to depression in men with normal hormone levels [3][4].
Detecting depression in the context of low testosterone can be challenging due to the complex range of issues associated with testosterone deficiency in men, as well as the lack of clarity regarding the mechanisms and causal relationships between depression and insufficient testosterone levels [5]. In this study, we examined the clinical features of depression in men with low testosterone levels (the main group) compared to men with depression and normal testosterone levels (the control group).
Objective: to investigate the clinical characteristics of depression in men with reduced testosterone levels.
The study included 140 men aged 18–65 years diagnosed with depressive episodes and recurrent depressive disorder according to the International Classification of Diseases, 10th revision (ICD-10).
All participants underwent measurement of total blood testosterone levels. Patients with testosterone levels below 12.1 nmol/L were referred for urological consultation for further evaluation and diagnosis of Testosterone Deficiency (E29) attributed to age-related and metabolic changes, excluding other forms. Patients with this diagnosis confirmed by the consulting physician were included in the main group (n = 90). Those with total testosterone levels above 12.1 nmol/L were assigned to the control group (n = 50).
The primary tool used in the study was the Patient Assessment Form for Depression with Concomitant Testosterone Deficiency, which included sociodemographic data and results of mental status evaluations obtained during clinical interviews. To quantitatively assess the severity of depressive and anxiety symptoms, the Hamilton Depression Rating Scale (HDRS) and Hamilton Anxiety Rating Scale (HARS) were employed [6][7]. The Gotland Male Depression Scale was used to identify features of depression presentation in men [8]. We utilized the Russian version of this scale, translated and adapted by D.A. Avtonomov [9].
The study was approved by the Local Independent Ethics Committee of Rostov State Medical University, Ministry of Health of Russia (Protocol No. 15/18, dated October 11, 2018).
The multifunctional φ-Fisher’s exact test was applied for statistical analysis of binary data (e.g., yes/no responses) and qualitative characteristics such as sociodemographic variables. The Mann-Whitney U test was conducted to compare clinical characteristics between the main and control groups, using nonparametric analysis. Additionally, the Benjamini-Hochberg procedure was applied to correct for multiple comparisons and control the false discovery rate, preserving the statistical power of the study. Parametric Student’s t-test was used to assess differences between groups for ratio-scale variables with assumed normal distribution.
Quantitative variables with non-normal distributions were presented as medians and interquartile ranges [Q1; Q3]. A p-value of < 0.05 was considered statistically significant in all analyses. Data processing and statistical analyses were performed using the Pandas [10] and SciPy [11] libraries in Python 3 [12].
The study analyzed symptoms across major domains of mental functioning. However, the summary table (Table 1) presents only those symptoms that showed statistically significant differences between the study groups.
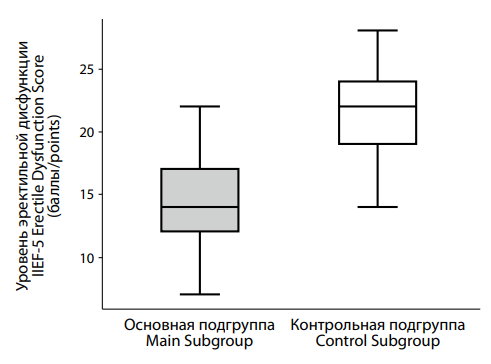
In the main group, erectile dysfunction was present in all patients without exception (100%, n = 90). In contrast, in the control group, increased libido was observed in 6% (n = 3) of patients. This difference was statistically significant (p = 0.044), confirming the influence of normal testosterone levels on sexual desire, even in the case of depressive syndrome.
This finding is further supported by a quantitative assessment of erectile dysfunction using the IIEF-5 scale. A significant difference was observed between the main and control groups (Figure 1). The median IIEF-5 score in the main group was 14.0 [ 12.0; 17.0], substantially lower than in the control group, where the median was 22.0 [ 19.0; 24.0]. According to the IIEF-5, higher scores indicate better erectile function. The difference between groups was highly statistically significant (p < 0.001), indicating worse erectile function among participants in the main group.
A notable difference between groups was also found in the symptom of slowed thinking. It was present in only 2.2% (n = 2) of the main group, but observed in 18% (n = 9) of the control group. This difference was statistically significant (p = 0.002), underscoring the importance of considering this factor in the study.
Melancholy was a significant symptom in both groups, reported by 46.7% (n = 42) of patients in the main group and 78% (n = 39) in the control group (p < 0.001).
Differences were also identified in the prevalence of hypoesthesia, affecting 15.6% (n = 14) of the main group and 36% (n = 18) of the control group, with the difference reaching statistical significance (p = 0.011). This suggests a possible link between depression with low testosterone levels and hypoesthesia.
The list continues with muscle weakness and irritability. Muscle weakness was observed in 12.2% (n = 11) of the main group and 14% (n = 7) of the control group, with no significant difference (p = 0.762). Irritability was reported by 20% (n = 18) of the main group and 28% (n = 14) of the control group, also without a statistically significant difference (p = 0.314).
Symptoms of anhedonia and social withdrawal were reported by a considerable number of participants in both groups. Anhedonia was present in 22.2% (n = 20) of the main group and 46% (n = 23) of the control group, with a significant difference (p = 0.007). Social withdrawal was noted in 30% (n = 27) of the main group and 54% (n = 27) of the control group, also showing a significant difference (p = 0.009).
Analysis of symptom distribution between patients with low and normal testosterone levels revealed several distinctive features. Most notably, decreased libido was observed in all patients with low testosterone, emphasizing the relationship between testosterone levels and sexual desire in men suffering from depression. Other symptoms, such as confusion, melancholy, and hypoesthesia, were more characteristic of patients in the control group.
Following the tradition established in Russian psychiatry, which places significant emphasis not only on the predominant symptoms but also on the defining syndrome, we examined the clinical characteristics of depressive syndrome in the main and control groups. The defining syndrome undoubtedly enhances our understanding of the patient’s current condition, diagnosis, and prognosis, and can influence the choice of therapeutic strategy [13].
Based on this approach, various researchers propose different typologies of depressive disorders according to the defining syndrome. Although a universally accepted classification of depression based on the leading syndrome exists, most researchers recognize the following subtypes: anxious, melancholic (dysphoric), adynamic, masked (larvated), atypical, depersonalization-derealization, anesthetic, and others [14].
As shown in Table 2, the adynamic form of depression was identified in 5.6% of patients (n = 5) in the main group and 8.0% (n = 4) in the control group; however, this difference was not statistically significant (p = 0.721). The anesthetic form was recorded in 1.1% (n = 1) of the main group and 4.0% (n = 2) of the control group, with no significant difference between groups (p = 0.290). A significant difference was observed in the distribution of the asthenic-depressive form, found in 46.7% (n = 42) of the main group and 22.0% (n = 11) of the control group (p = 0.006). The masked (larvated) form was present in 8.9% (n = 8) of the main group and 12.0% (n = 6) of the control group, with no significant difference (p = 0.568). The melancholic form was reported in 23.3% (n = 21) of the main group and 34.0% (n = 17) of the control group, with no significant difference (p = 0.234). Lastly, the anxious form was observed in 14.4% (n = 13) of the main group and 20.0% (n = 10) of the control group, also without a significant difference (p = 0.476). Thus, the distribution of depressive syndrome subtypes was generally similar across both groups, with the exception of the asthenic-depressive form, significantly more frequent in the group with testosterone deficiency.
Analysis of the distribution of depressive forms (including adynamic, anesthetic, asthenic-depressive, masked (larvated), melancholic, and anxious) revealed a statistically significant difference only for the asthenic-depressive form, which occurred more often in patients with testosterone deficiency. In all other cases, the distribution of depressive forms was similar between groups.
Next, we focused on analyzing quantitative differences in depression severity between the control and main groups.
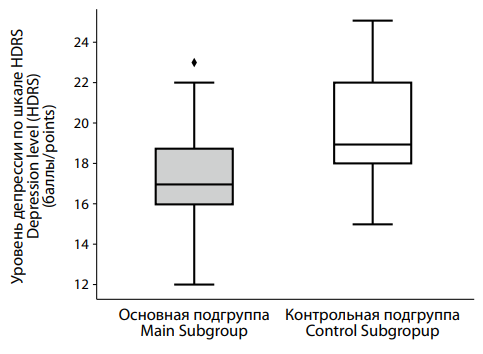
According to the HDRS results (Figure 2), patients in the main group with low testosterone levels scored a median of 17.0 [ 16.0; 18.75], while those in the control group scored higher, with a median of 19.0 [ 18.0; 22.0]. This difference was statistically significant (p < 0.001).
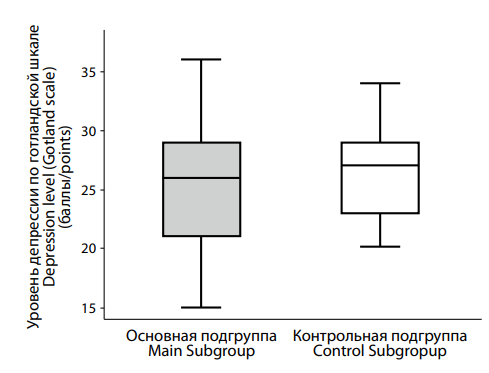
Analysis of depression severity using the Gotland Male Depression Scale (Figure 3) showed median scores of 27.0 [ 23.0; 29.0] in the control group and 26.0 [ 21.0; 29.0] in the main group. No statistically significant difference was found (p = 0.218), indicating a comparable degree of depression in both groups according to this scale.
Table 3 presents the distribution of patients according to clinical severity based on the Clinical Global Impression-Severity (CGI-S) scale. In the main group, 20.0% (n = 18) were classified as having a marked severity, 26.7% (n = 24) mild, and 53.3% (n = 48) moderate. In the control group, these figures were 30.0% (n = 15), 12.0% (n = 6), and 58.0% (n = 29), respectively. Differences between groups were not statistically significant; however, the difference in the proportion of patients with mild severity approached significance (p = 0.053).
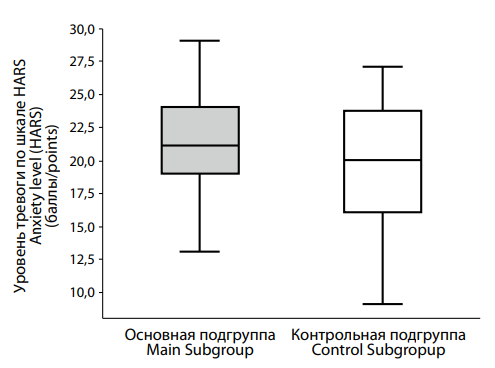
We also examined anxiety levels in both groups. The HARS results (Figure 4) revealed a trend toward higher anxiety in the main group, with median scores of 21.0 [ 19.0; 24.0], compared to 20.0 [ 16.0; 23.75] in the control group. Although the difference did not reach statistical significance (p = 0.082), it suggests a tendency for elevated anxiety in men with low testosterone.
In summary, our analysis showed that depression severity measured by HDRS was lower in the main group; this suggests that testosterone deficiency may be associated with less severe depressive symptoms as assessed by HDRS. In contrast, the Gotland Male Depression Scale did not reveal significant differences between groups, highlighting varying sensitivities between the Hamilton and Gotland scales in detecting depressive symptoms in men. This underscores the importance of selecting appropriate diagnostic tools and indicates potential directions for future research.
The CGI-S severity ratings similarly showed no statistically significant differences between the groups, although the difference in mild severity distribution approached statistical significance (p = 0.053).
The distribution of study participants by diagnosis was uneven. In the main group, 43.3% (n = 39) were diagnosed with recurrent depressive disorder (F33), while 56.7% (n = 51) had a single depressive episode (F32). The control group showed a different distribution, with 64% (n = 39) diagnosed with recurrent depressive disorder and 36% (n = 18) with a single depressive episode. This difference in distribution was statistically significant (p = 0.03).
Next, we present the statistical analysis results of disease onset characteristics and constitutional-biological features among the study cohorts.
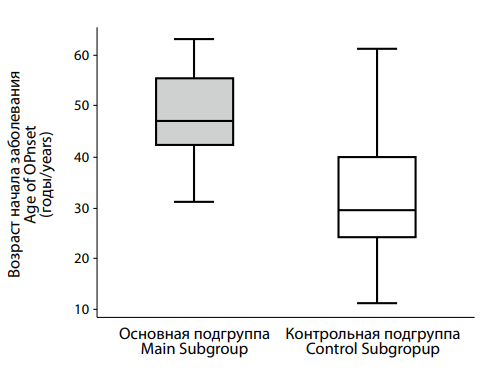
The median age at onset in the control group was 29.5 [ 24.25; 40.0] years, whereas in the main group it was significantly higher at 47.0 [ 42.0; 55.0] years. The difference was statistically significant (p < 0.001).
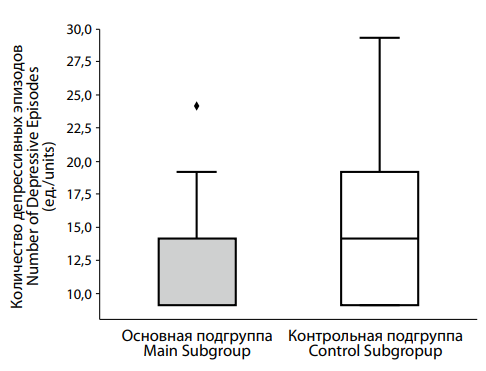
Analysis of the number of depressive episodes between groups (Figure 6) showed that the control group had a median of 2.0 [ 1.0; 3.0] episodes, compared to 1.0 [ 1.0; 2.0] episodes in the main group. The difference was statistically significant (p = 0.003), suggesting that the groups differ meaningfully in this respect.
As shown in Table 4, 87.8% (n = 79) of participants in the main group exhibited no functional impairment, while 12.2% (n = 11) showed a functional decline. Conversely, in the control group, 36.0% (n = 18) had functional impairment, and 64.0% (n = 32) did not. These differences were statistically significant (p = 0.002).
In summary, several statistically significant differences were identified between the control and main groups in terms of age at illness onset, the number of depressive episodes, and the level of functional impairment.
When studying the clinical features of depression in men with normal and low testosterone levels, it is particularly important to examine the coping strategies used by these patient groups. Substance use cannot be overlooked in this context – numerous studies show that men often turn to alcohol and drugs as a way to cope with depressive and anxiety symptoms. However, this approach not only fails to provide genuine relief but may also complicate the clinical picture by masking underlying affective disorders and hindering access to appropriate specialized care.
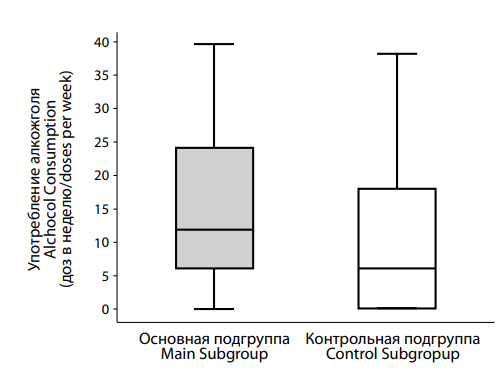
Analysis of alcohol consumption in the control and main groups (Figure 7) revealed statistically significant differences (p = 0.009). The control group reported the median alcohol intake of 6.0 [ 0.0; 18.0] doses per week, whereas the main group had a significantly higher median intake of 12.0 [ 6.0; 24.0] doses.
This study examined the constitutional and biological characteristics of patients with depression in the context of hypotestosteronemia. Our research focused on analyzing differences in body weight, waist circumference, and erectile function between the main and control groups.
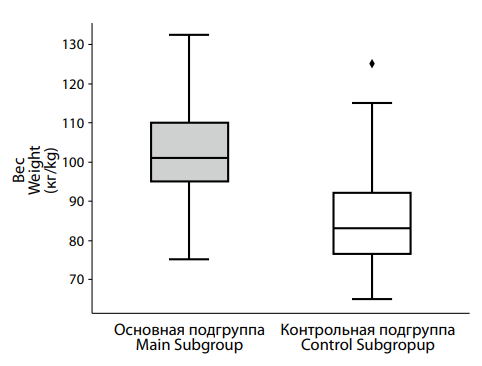
A comparison of body weight between the control and main groups (Figure 8) revealed the median weight of 101.0 [ 95.0; 110.0] kg in the main group, significantly higher than the median weight of 83.0 [ 76.5; 92.0] kg observed in the control group. This difference was statistically significant (p < 0.001).
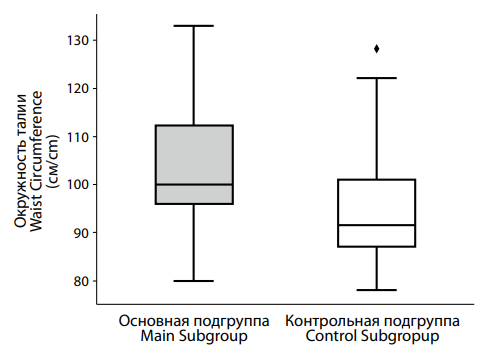
Analysis of waist circumference (Figure 9) also showed significant differences between groups. The main group had a median waist circumference of 100.0 [ 96.0; 112.0] cm, compared to 91.5 [ 87.0; 101.0] cm in the control group. The statistical significance of this difference (p < 0.001) confirms that it is unlikely to be due to chance.
|
Таблица / Table 1 Симптомы, частота встречаемости которых в группах сравнения имеет статистически значимые различия Symptoms whose frequency of occurrence in the comparison groups has statistically significant differences |
|
|||
|
Симптом Symptom |
Основная группа Main subgroup (n=90) |
Контрольная группа Control subgroup
(n=50) |
φ – эмпирическое φ – empirical |
|
|
Гипестезия Hypoesthesia |
15.6% (n = 14) |
36.0% (n = 18) |
3.054 * (p = 0.011) |
|
|
Дневная сонливость Daytime sleepiness |
47.8% (n = 43) |
24.0% (n = 12) |
0.345 * (p = 0.007) |
|
|
Кошмарные сновидения Nightmares |
23.3% (n = 21) |
8.0% (n = 4) |
0.286 * (p = 0.036) |
|
|
Поверхностный, чуткий сон Light sleep |
37.8% (n = 34) |
20.0% (n = 10) |
0.412 * (p = 0.037) |
|
|
Раздражительность, агрессия Irritability, aggression |
63.3% (n = 57) |
40.0% (n = 20) |
0.386 * (p = 0.013) |
|
|
Замедление мышления Slowed thinking |
2.2% (n = 2) |
18.0% (n = 9) |
9.659 * (p = 0.002) |
|
|
Эректильная дисфункция Erectile dysfunction |
100.0% (n = 90) |
54.0% (n = 27) |
0.000 * (p = <0.001) |
|
|
Тоска Melancholy |
46.7% (n = 42) |
78.0% (n = 39) |
4.052 * (p = <0.001) |
|
|
Эмоциональная лабильность Emotional lability |
44.4% (n = 40) |
26.0% (n = 13) |
0.439 * (p = 0.045) |
|
|
Примечание: * — статистически значимые различия, p — уровень статистической значимости различий. Note: * — statistically significant differences, p — level of statistical significance of differences. |
|
|||
 |
|
Рисунок 1. Различия в показателях эректильной дисфункции по шкале IIEF-5 между подгруппами пациентов с депрессией на фоне сниженного (основная подгруппа) и нормального (контрольная подгруппа) уровня тестостерона. Figure 1. Differences in erectile dysfunction scores on the IIEF-5 scale between subgroups of patients with with testosterone deficiency (main subgroup) and normal (control subgroup) testosterone levels. |
|
Таблица / Table 2 Распределение пациентов в основной и контрольной подгруппах в зависимости от варианта депрессивного синдрома Distribution of patients in the main and control subgroups depending on the type of depressive syndrome |
|
|||
|
Харакетристика депрессивного синдрома Depressive syndrome |
Основная группа Main subgroup N=90 |
Контрольная группа Control subgroup N=50 |
φ – эмпирическое φ – empirical |
|
|
Адинамическая депрессия Adynamic depression |
5.6% (n = 5) |
8.0% (n = 4) |
0.676 (p = 0.721) |
|
|
Анестетическая депрессия Anesthetic depression |
1.1% (n = 1) |
4.0% (n = 2) |
0.270 (p = 0.290) |
|
|
Астено-депрессивный синдром Astheno-depressive syndrome |
46.7% (n = 42) |
22.0% (n = 11) |
3.102* (p = 0.006) |
|
|
Ларвированная депрессия Masked depression |
8.9% (n = 8) |
12.0% (n = 6) |
0.715 (p = 0.568) |
|
|
Меланхолическая депрессия Melancholic depression |
23.3% (n = 21) |
34.0% (n = 17) |
0.591 (p = 0.234) |
|
|
Тревожная депрессия Depression with anxiety |
14.4% (n = 13) |
20.0% (n = 10) |
0.675 (p = 0.476) |
|
Примечание: * — статистически значимые различия, p — уровень статистической значимости различий.
Note: * — statistically significant differences, p — level of statistical significance of differences.
 |
|
Рисунок 2. Различия в тяжести депрессии по шкале HDRS между пациентами с депрессией на фоне сниженного (основная подгруппа) и нормального (контрольная подгруппа) уровня тестостерона. Figure 2. Differences in the severity of depression according to the HDRS scale between patients with testosterone deficiency (main subgroup) and normal (control subgroup) testosterone levels. |
 |
|
Рисунок 3. Различия в тяжести депрессии по готландской шкале между пациентами с депрессией на фоне сниженного (основная подгруппа) и нормального (контрольная подгруппа) уровня тестостерона. Figure 3. Differences in the severity of depression according to the Gotland scale between patients with testosterone deficiency (main subgroup) and normal (control subgroup) testosterone levels. |
|
Таблица / Table 3 Распределение пациентов в основной и контрольной подгруппах, в зависимости от тяжести состояние, определяемого по шкале CGI-S Distribution of patients in the main and control subgroups, depending on the severity of the condition, determined by the CGI-S scale |
||||
|
Тяжесть состояния по шкале CGI-S Clinical Global Impression Scale |
Основная группа Main subgro N=90 |
Контрольная группа Control subgroup N=50 |
φ – эмпирическое φ – empirical |
|
|
Выраженная Moderately ill |
20.0% (n = 18) |
30.0% (n = 15) |
0.583 (p = 0.214) |
|
|
Легкая Mildly ill |
26.7% (n = 24) |
12.0% (n = 6) |
2.667 (p = 0.053) |
|
|
Умеренно-выраженная Markedly ill |
53.3% (n = 48) |
58.0% (n = 29) |
0.828 (p = 0.723) |
|
|
Примечание: * — статистически значимые различия, p — уровень статистической значимости различий. Note: * — statistically significant differences, p — level of statistical significance of differences. |
||||
 |
|
Рисунок 4. Различия в выраженности тревоги по шкале HARS у пациентов с депрессией на фоне сниженного (основная подгруппа) и нормального (контрольная подгруппа) уровня тестостерона. Figure 4. Differences in the severity of anxiety according to the HARS scale in patients with testosterone deficiency (main subgroup) and normal (control subgroup) testosterone levels. |
 |
|
Рисунок 5. Различия в возрасте начала депрессии на фоне сниженного (основная подгруппа) и нормального (контрольная подгруппа) уровня тестостерона. Figure 5. Differences in the age of onset of depression with testosterone deficiency (main subgroup) and normal (control subgroup) testosterone levels. |
 |
|
Рисунок 6. Различия в числе депрессивных эпизодов у пациентов с депрессией на фоне сниженного (основная подгруппа) и нормального (контрольная подгруппа) уровня тестостерона. Figure 6. Differences in the number of depressive episodes in patients with testosterone deficiency (main subgroup) and normal (control subgroup) testosterone levels. |
|
Таблица / Table 4 Распределение пациентов в основной и контрольной подгруппах в зависимости от наличия функционального снижения из-за заболевания Distribution of patients in the main and control subgroups depending on the presence of functional decline due to disease |
||||
|
Функциональное снижение из-за заболевания Functional impairment |
Основная группа Main subgroup N=90 |
Контрольная группа Control subgroup N=50 |
φ – эмпирическое φ – empirical |
|
|
Отсутствует No |
87.8% (n = 79) |
64.0% (n = 32) |
4.040* (p = 0.002) |
|
|
Есть Yes |
12.2% (n = 11) |
36.0% (n = 18) |
0.248* (p = 0.002) |
|
|
Примечание: * — статистически значимые различия, p — уровень статистической значимости различий. Note: * — statistically significant differences, p — level of statistical significance of differences.* – статистически значимые различия |
||||
 |
|
Рисунок 7. Различия в количестве употребляемого алкоголя в течение недели пациентами с депрессией на фоне сниженного (основная подгруппа) и нормального (контрольная подгруппа) уровня тестостерона. Figure 7. Differences in the alcohol consumption per week by patients with testosterone deficiency (main subgroup) and normal (control subgroup) testosterone levels. |
 |
|
Рисунок 8. Различия в показателях веса между подгруппами пациентов с депрессией на фоне сниженного (основная подгруппа) и нормального (контрольная подгруппа) уровня тестостерона. Figure 8. Differences in weight indicators between subgroups of patients with testosterone deficiency (main subgroup) and normal (control subgroup) testosterone levels. |
 |
|
Рисунок 9. Различия в показателях окружности талии между подгруппами пациентов с депрессией на фоне сниженного (основная подгруппа) и нормального (контрольная подгруппа) уровня тестостерона. Figure 9. Differences in waist circumference between subgroups of patients with testosterone deficiency (main subgroup) and normal (control subgroup) testosterone levels. |
Depressive symptoms are among the nonspecific signs of testosterone deficiency [4]. Often, clinicians pay less attention to them, focusing more closely on symptoms of sexual dysfunction and metabolic abnormalities. Patients themselves frequently emphasize these latter symptoms, centering discussions primarily around sexual dysfunction, low energy, and metabolic issues. This pattern was confirmed in our study, where 100% of patients with depression and low testosterone levels exhibited sexual dysfunction, compared to 54% in the control group (p < 0.001). The high prevalence of sexual dysfunction in men with depression but with normal testosterone levels suggests that this symptom is a key factor motivating men to seek specialist help. In contrast, classical symptoms such as anhedonia, low mood, and cognitive impairments may not be recognized by men as signs of illness, potentially delaying their decision to seek medical assistance.
Sexual dysfunction in men (associated with testosterone deficiency or depression) requires a more attentive and structured approach from urologists, endocrinologists, and andrologists to screen for possible depression. Likewise, psychiatrists should pay closer attention to endocrine status to reduce the risk of underdiagnosing testosterone deficiency.
In the control group, more pathognomonic symptoms of depression (such as melancholy, hypesthesia, anhedonia, and social withdrawal) predominated, reflecting a more classical presentation of the depressive triad and the so-called “endogenous” subtype as understood in the Russian psychiatric tradition [13]. Meanwhile, in the main group, symptoms such as irritability, sleep disturbances, and emotional lability were more prominent alongside classic depressive symptoms.
This shift toward symptom patterns characteristic of adjustment disorders and stress-related disorders is also supported by the differing depressive syndromes observed in the main and control groups. Asthenic features were more common in men with low testosterone, whereas melancholic and adynamic forms were more frequently seen in the control group.
These clinical differences may partly explain variations in illness severity [14]. The main group showed a later age of onset, fewer depressive episodes, and a smaller proportion of patients with functional impairment. Functional impairment here refers to reduced daily activities, including work, leisure, and social interactions. This pattern can be interpreted as reflecting more severe symptoms within the clinical group. Conversely, patients in the overall group tended to maintain social activity as a coping strategy against threats to their social status – something that becomes far more difficult under conditions of severe depression.
Taken together, these differences in depression manifestations may point to a pathogenetic role of testosterone deficiency, which is important in stress resilience and emotional regulation [15]. This suggests that low testosterone may contribute secondarily to depression development rather than serving merely as a triggering factor in patients predisposed to recurrent depressive disorder.
The differences in the severity of depressive symptoms and levels of functional impairment can be explained by various mechanisms. In the control group, depressive episodes were more severe and caused greater disruption to daily activities, likely due to the predominance of the classical “vital” component of depression. However, anxiety levels did not differ significantly between the groups. This may be explained by lowered testosterone in the main group, reducing its influence on the GABAergic system, while causing fewer changes in brain regions responsible for the classic depressive symptoms.
Losing the natural stress protection provided by testosterone, men in the main group more frequently resorted to alternative coping strategies, including alcohol consumption, with a median intake twice as high as that in the control group (p = 0.009).
The use of alcohol by men as a coping mechanism for stress and emotional regulation is well documented [16]. Alcohol consumption can significantly worsen affective disturbances and sexual dysfunction, creating a vicious cycle. Therefore, thorough assessment of alcohol history by psychiatrists, addiction specialists, urologists, andrologists, and other healthcare providers should become an integral part of routine medical consultations with male patients.
Analysis of constitutional and biological parameters in patients with depression and hypogonadism revealed predictable features, considering the key role of testosterone in male sexual constitution and function. The main group showed significantly higher body weight and waist circumference compared to the control group, with statistical significance. Although these higher measures in the main group are likely related to pathophysiological mechanisms contributing to testosterone deficiency [3], establishing clear cause-and-effect relationships remains challenging. Excess body weight itself is a risk factor for depression independent of testosterone levels [17]. Therefore, it remains unclear whether testosterone deficiency is a key contributing factor to depressive syndrome development or simply one of many factors involved.
Our study demonstrated that depression associated with testosterone deficiency exhibits several distinctive features that differ significantly from depression occurring with normal testosterone levels. These differences should be taken into account when developing diagnostic and therapeutic algorithms. However, depression linked to low testosterone should not be regarded merely as a general symptom complex of testosterone deficiency; rather, it should be considered as a distinct nosological entity.
1. Tyuvina NA, Balabanova VV, Voronina EO. The differential diagnosis and treatment of depressive disorders in climacteric transition. S.S. Korsakov. Journal of Neurology and Psychiatry. 2017;117(3):22 27. (In Russ.) https://doi.org/10.17116/jnevro20171173122-27
2. Rodgers S, Grosse Holtforth M, Hengartner MP, Müller M, Aleksandrowicz AA, et al. Serum testosterone levels and symptom-based depression subtypes in men. Front Psychiatry. 2015;6:61. https://doi.org/10.3389/fpsyt.2015.00061
3. Kogan M.I., Vorobyev S.V., Khripun I.A., Belousov I.I., Ibishev H.S. Testosterone: from sexuality to metabolic control. Rostov оn Don: Phoenix; 2017. (In Russ)
4. Määttänen I, Gluschkoff K, Komulainen K, Airaksinen J, Savelieva K, et al. Testosterone and specific symptoms of depression: Evidence from NHANES 2011-2016. Compr Psychoneuroendocrinol. 2021;6:100044. https://doi.org/10.1016/j.cpnec.2021.100044
5. Aleksandrovsky Yu.A., Bukhanovsky A.O., Volel B.A., Volkova N.I., Dubatova I.V., et al. Borderline psychiatry and psychosomatics. Moscow; 2021. (In Russ.) 6. Hamilton M. A rating scale for depression. J Neurol Neurosurg Psychiatry. 1960;23(1):56-62. https://doi.org/10.1136/jnnp.23.1.56
6. Hamilton M. The assessment of anxiety states by rating. Br J Med Psychol. 1959;32(1):50-55. https://doi.org/10.1111/j.2044-8341.1959.tb00467.x
7. Zierau F, Bille A, Rutz W, Bech P. The Gotland Male Depression Scale: a validity study in patients with alcohol use disorder. Nord J Psychiatry. 2002;56(4):265-271. https://doi.org/10.1080/08039480260242750
8. Avtonomov D.A. Male depressive syndrome. Nezavisimost’ lichnosti. 2014;2:8–11. (in Russ.) eLIBRARY ID: 50264675 EDN: SFPMMM
9. McKinney W. Data structures for statistical computing in python. Proceedings of the 9th Python in Science Conference. 2010;445:51–56. https://doi.org/10.25080/Majora-92bf1922-00a
10. Virtanen P, Gommers R, Oliphant TE, Haberland M, Reddy T, et al. SciPy 1.0: fundamental algorithms for scientific computing in Python. Nat Methods. 2020;17(3):261-272. Erratum in: Nat Methods. 2020;17(3):352. https://doi.org/10.1038/s41592-019-0686-2
11. Van Rossum G., Drake F.L. Python 3 reference manual. Scotts Valley, CA: CreateSpace, 2010.
12. Azamatova V.V., Antsyborov A.V., Boyko E.O., Bukhanovsky A.O., Vasenina E.E., et al. Short course in psychiatry. Rostov-on-Don, 2019. (in Russ.)
13. Bukhanovsky A.O., Kutyavin Yu.A., Litvak M.E., Azamatova V.V., Perekhov A.Ya., et al. General psychopathology. Moscow, 2022. (in Russ.)
14. Harman SM, Metter EJ, Tobin JD, Pearson J, Blackman MR; Baltimore Longitudinal Study of Aging. Longitudinal effects of aging on serum total and free testosterone levels in healthy men. Baltimore Longitudinal Study of Aging. J Clin Endocrinol Metab. 2001;86(2):724-731. https://doi.org/10.1210/jcem.86.2.7219
15. Mangolim AS, Brito LAR, Nunes-Nogueira VDS. Effectiveness of testosterone replacement in men with obesity: a systematic review and meta-analysis. Eur J Endocrinol. 2021;186(1):123-135. https://doi.org/10.1530/EJE-21-0473
16. McHenry J, Carrier N, Hull E, Kabbaj M. Sex differences in anxiety and depression: role of testosterone. Front Neuroendocrinol. 2014;35(1):42-57. https://doi.org/10.1016/j.yfrne.2013.09.001
Yuriy Yu. Osadshiy, Junior Research Fellow of the Department of Psychiatry and Narcology
Rostov-on-Don
Authors declare no conflict of interest
Marina N. Kryuchkova, Cand. Sci. (Med.), Associate Professor of the Department of Psychiatry and Narcology
Rostov-on-Don
Authors declare no conflict of interest
Alexey A. Sidorov, psychiatrist-narcologist at the Center for Psychological Support
Rostov-on-Don
Authors declare no conflict of interest
Aleksei Y. Perekhov, Cand. Sci. (Med.), Associate Professor of the Department of Psychiatry and Narcology
Rostov-on-Don
Authors declare no conflict of interest
Osadshiy Yu.Yu., Kryuchkova M.N., Sidorov A.A., Perekhov A.Ya. Clinical features of depression in men with testosterone deficiency. Medical Herald of the South of Russia. 2025;16(2):55-64. (In Russ.) https://doi.org/10.21886/2219-8075-2025-16-2-55-64
29, Nakhichevansky Lane, Rostov-on-Don, 344002
Rostov State Medical University
Тel.: +79185710558
e-mail: rostgmu-journal@rambler.ru


